Budgets
Get a complete financial overview of all your projects in one place — budgets, expenses, revenue, and profit and loss at a glance.
Key Features
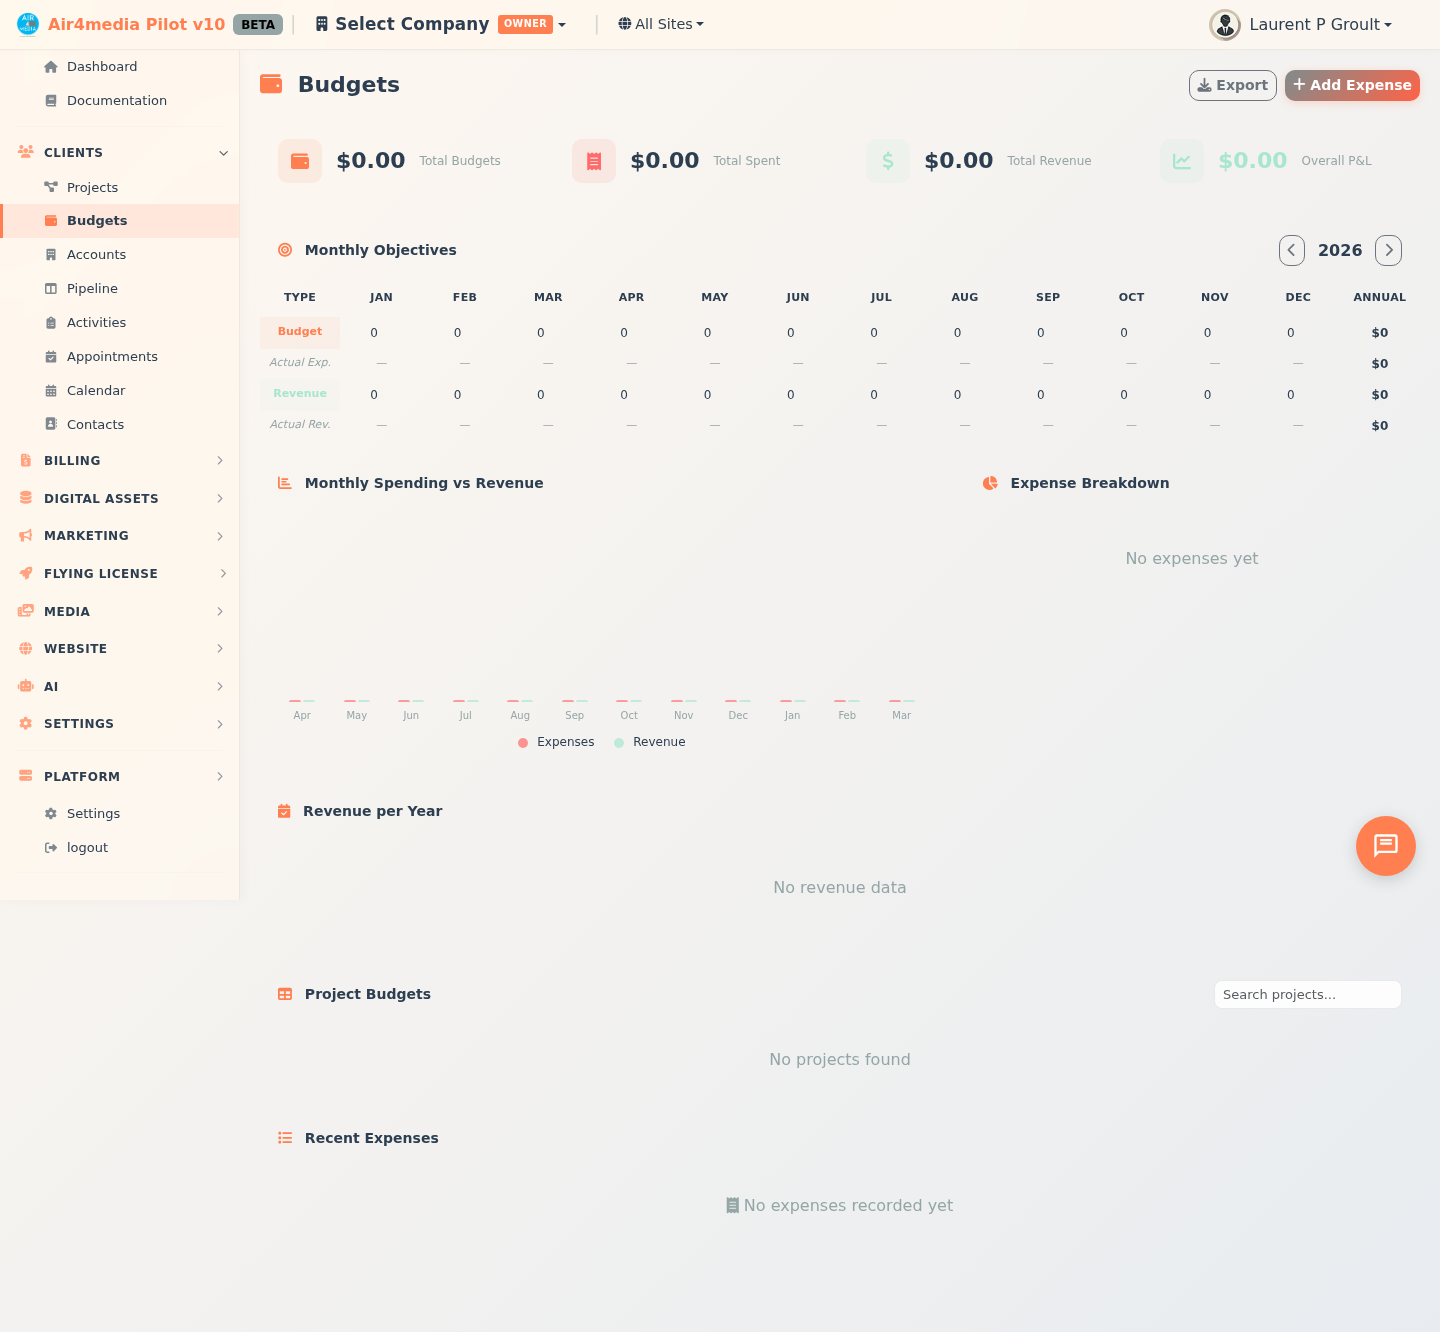
- KPI Summary Cards: See your total annual budgets, total amount spent, total revenue collected, and overall profit & loss at the top of the page. The P&L value and icon turn green when positive and red when negative.
- Monthly Objectives Grid: Set company-wide monthly spending and revenue targets for any year, side by side with actual figures. Four rows span each month: budget target, actual expenses (with % of target), revenue target, and actual revenue (with % of target). Edit any target cell directly — changes save automatically after a moment.
- Monthly Trend Chart: A 12-month bar chart comparing expenses vs. revenue so you can spot seasonal patterns at a glance.
- Expense Breakdown: A visual breakdown of spending by category (Equipment, Labor, Venue, Travel, Materials, Subcontractor, Software, Insurance, Marketing, Other) showing each category's share of total costs.
- Revenue per Year: A horizontal bar chart showing realized revenue for each calendar year across your full history, with the current year highlighted.
- Project Budgets Table: A sortable table listing every project with its account, annual budget, total spent, percentage used (with a progress bar), revenue target, actual revenue, and P&L. Each project shows a status badge: Under, On Target, or Over budget.
- Recent Expenses: The 10 most recent expenses across all projects, with category, date, and amount.
- Add Expense: Log a new expense against any project directly from this page.
- Export: Download the full project budget table as a CSV file.
How to Use
Reading the dashboard
- Open Budgets from the sidebar.
- The four KPI cards at the top give you an instant snapshot — total budgets allocated, money spent, revenue earned, and net P&L.
- Scroll down to see charts and the full project table.
Setting monthly objectives
- Find the Monthly Objectives section.
- Use the arrow buttons to navigate between years.
- The grid shows four rows for each month: budget target, actual expenses, revenue target, and actual revenue. Actual rows display a percentage vs. your target when both values exist. The annual total appears on the right.
- Click any budget or revenue target cell and type a new amount. The annual total updates instantly and your changes save automatically.
Logging an expense
- Click Add Expense in the top-right corner.
- Select the project, enter a description, amount, and date.
- Choose a category (Equipment, Labor, Venue, Travel, Materials, Subcontractor, Software, Insurance, Marketing, or Other) and type (Direct Expense, Vendor Bill, or Resource Cost).
- Add optional notes and check Billable to client if the cost will be passed on.
- Click Save Expense.
Viewing project details
- Click any row in the Project Budgets table to open that project's detail page.
Exporting data
- Click Export in the top-right corner to download a CSV with all project budget figures.
Tips
- Budget status thresholds: Under means spending is at or below 90% of budget; On Target is 90–110%; Over (red) means spending has exceeded 110% — use Monthly Objectives to catch overruns early.
- The P&L column reflects paid invoices only, so it updates as payments are recorded on your invoices.
- Expenses marked as billable are tracked per project and can be referenced when invoicing the client.
- Use the search box above the project table to quickly find a specific project by name or account.
- The Monthly Objectives grid is company-wide, not per-project — use it to plan your overall annual targets.
- The Revenue per Year chart lets you compare performance across multiple years at a glance.